Skip to content ↓

Geography fieldwork

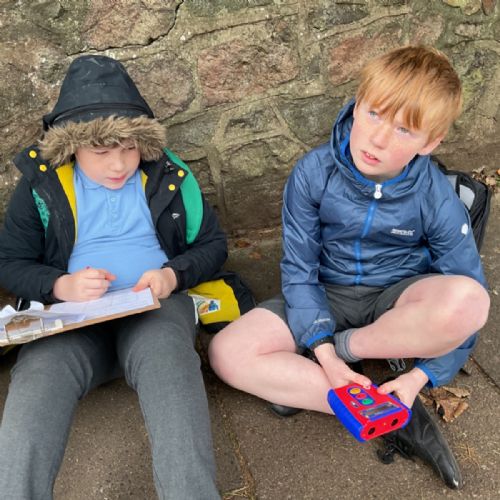
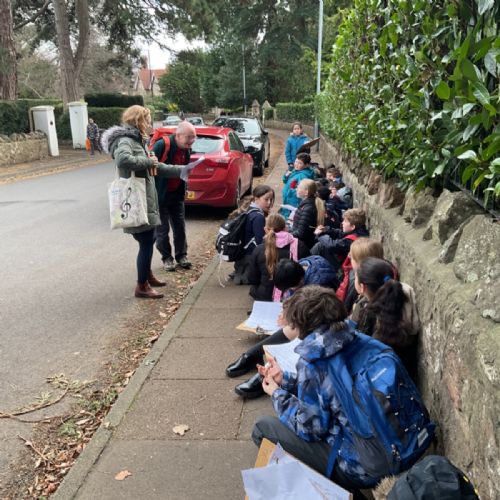
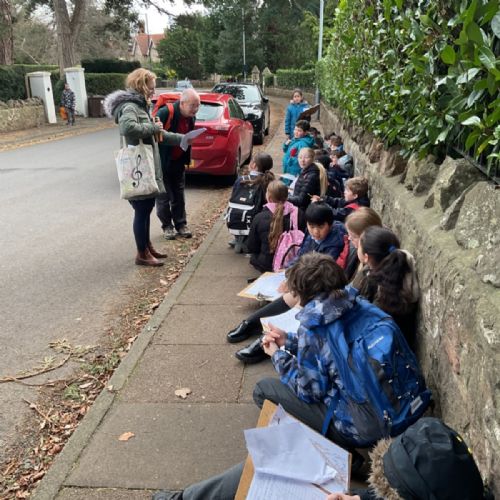
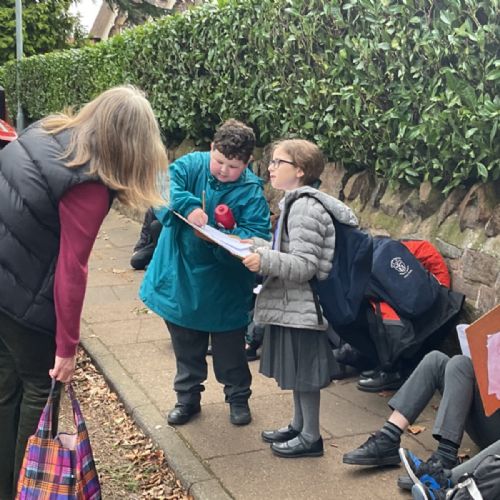
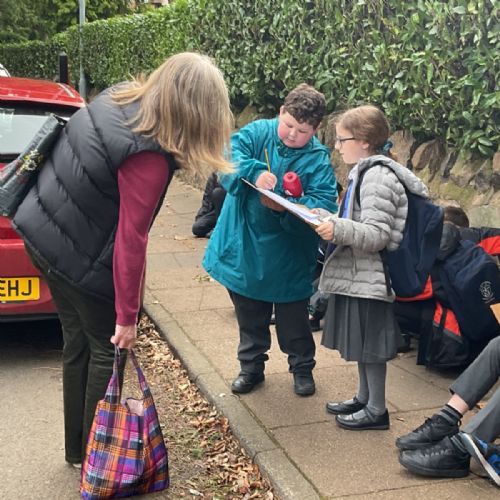
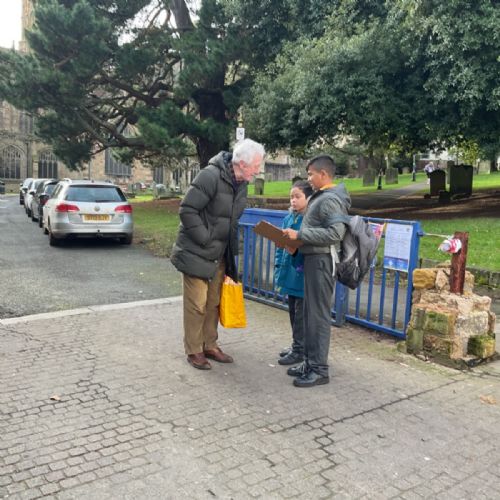
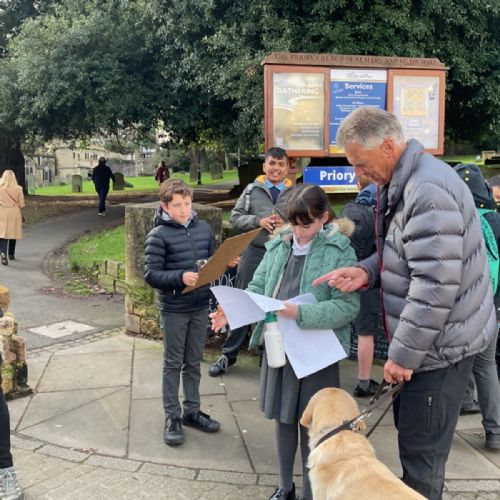
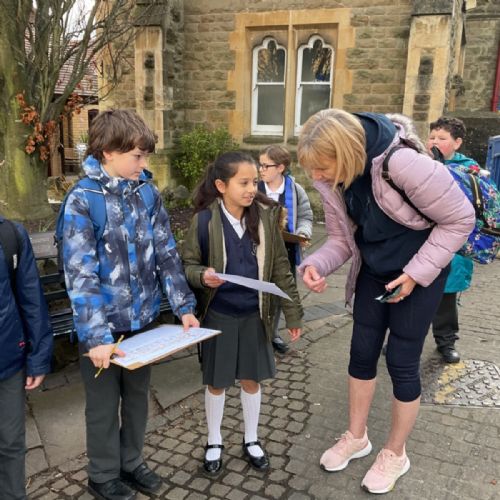
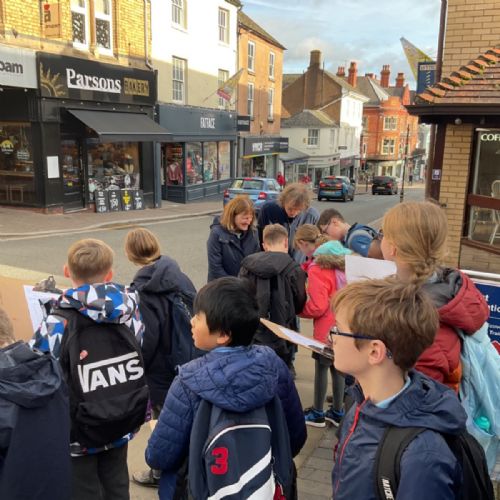
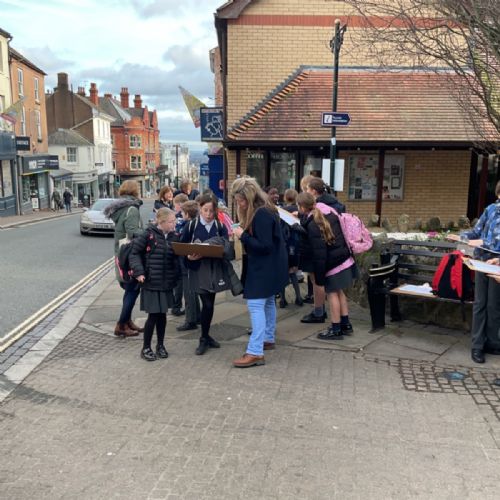
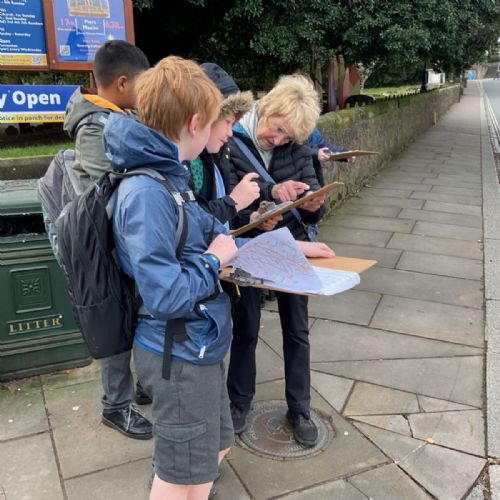
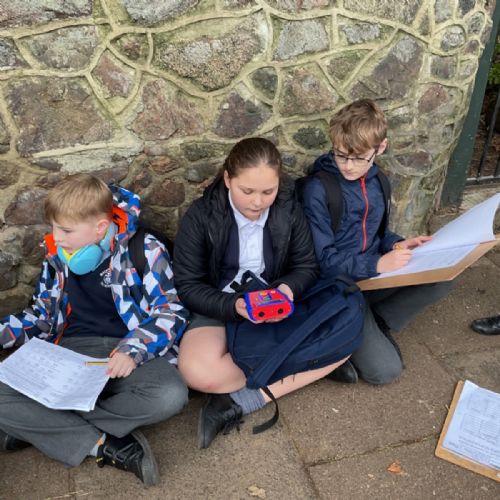
We interviewed some people who were out and about in Malvern to ask them about whether they thought the area was affected by litter or traffic. We collected their opinions using a Likert scale. We also collected quantitative data - a tally chart for our traffic count and we used a data logger to monitor sound levels. We visited two areas - one that looked more built up on the OS mapping and another that looked less busy.

  • 4DA704BC-92A8-4C50-A2DC-AE5C89FF6124.jpeg
    12080
  • E2B41E4D-8335-4C54-AB9A-76F3F2CBD8CA.jpeg
    12079
  • 8FE6A963-692F-420C-A18D-DDB7AD1F1A26.jpeg
    12078
  • 81B08DA2-546A-4782-A856-7CE324A4F3A6.jpeg
    12077
  • E5AF4968-F8C7-4285-A18B-BA4214A06CFB.jpeg
    12076
  • 230E5F90-2BED-4090-B83C-2FB5E49CB7FE.jpeg
    12075
  • 9B83607D-5EAE-4321-9EDB-B76F07C41B28.jpeg
    12074
  • F0FCDCEC-5FFD-4F57-83A0-494688D95C7E.jpeg
    12073
  • C72E150B-AFEC-4922-B956-A260EBE84EEC.jpeg
    12072
  • 48AFDCBA-4A79-417D-A776-E8178C17A43D.jpeg
    12081
  • 0679E08E-D7CF-4AF7-83C0-0FA9D25A9FEE.jpeg
    12082
  • 618303AF-340C-4FBA-B91C-7E8D8D59F340.jpeg
    12083
  • A6D46358-35B0-4834-AD0A-D2419086410A.jpeg
    12084
  • 02EC62F0-F2E8-49D8-A617-2B3F4FBBFFC2.jpeg
    12085
  • 087F32BA-110A-4954-8BA6-46D77FDFAD38.jpeg
    12086
  • 11018150-E943-4C93-88A0-01053B44F4B2.jpeg
    12087
  • 0787E233-6A0D-48DC-9B65-CB0FE51BF8C3.jpeg
    12088
  • 8AAE9C9F-817C-4AD5-A19A-959DFDE29E39.jpeg
    12089